SHSubjectHub

Global circulation, climate change and the UK climate quiz games for GCSE Geography A (Edexcel)

5 live games for GCSE Geography A (Edexcel), 75 questions. Preview every question free. Hosting GCSE Geography A (Edexcel) sets comes with a school package.

Global circulation, climate change and the UK climate for GCSE Geography A (Edexcel): 5 ready-made live quiz games, 75 questions in all.

The questions cover Reading climate graphs, Climate change causes and management and Climate types.

There are 3 picture rounds and 2 quickfire rounds. Question types: 51 multiple choice, 21 true or false and 3 matching. 60 questions have a picture.

Preview every set here. Hosting GCSE Geography A (Edexcel) sets comes with a school package, from £150 a year for the whole school.

The gamesEach set is a fixed list of questions. Open a preview to see a few of them.

Quickfire: Global circulation, climate change and the UK climate

GCSE15 questions· Warm-up

Plays in 17 of 17 game modes, including Gold Rush, Big Catch and Speed Blitz.
Preview 3 sample questions
  1. 1

    Causes of climate change: true or false?

    Farming can release methane, a greenhouse gas.
  2. 2

    True or false?

    Building sea walls is mitigation because it cuts emissions.
  3. 3

    True or false?

    Changing to crops that suit hotter weather is adaptation.

+ 12 more questions in the game.

Quickfire: Climate graphs

GCSE15 questions· Warm-up· all pictures

Plays in 13 of 17 game modes, including Gold Rush, Big Catch and Fossil Hunt.

Preview 3 sample questions
  1. 1
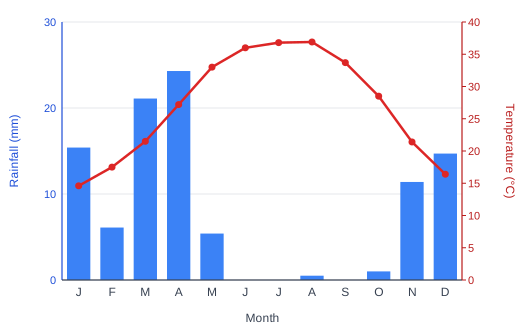
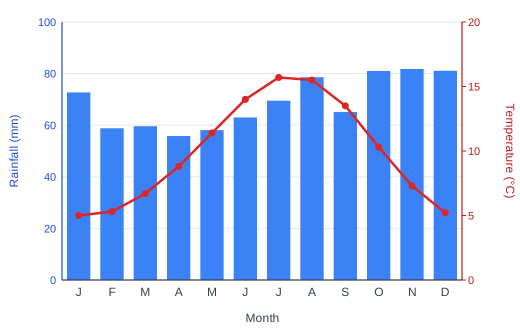
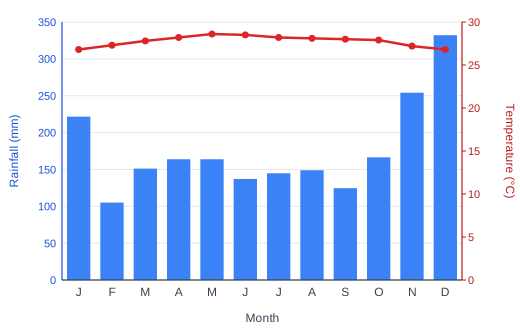
    A climate graph: monthly rainfall bars and a temperature line

    Picture: Data: WMO 1991-2020 climate normals, NOAA NCEI

    Climate graph for Singapore. Which month is wettest?

    FebruaryMarchDecemberNovember
  2. 2
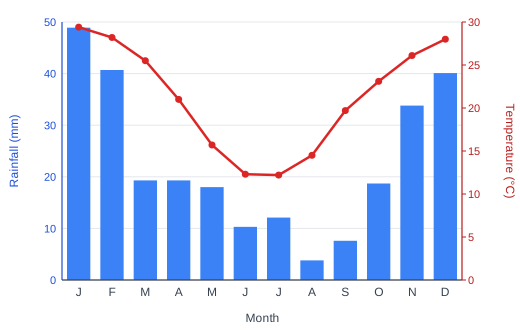
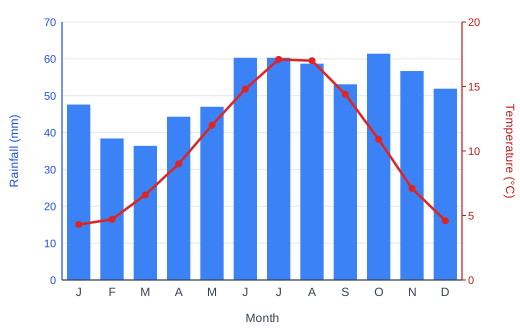
    A climate graph: monthly rainfall bars and a temperature line

    Picture: Data: WMO 1991-2020 climate normals, NOAA NCEI

    Climate graph for Riyadh. Which month is wettest?

    MarchAprilSeptemberMay
  3. 3
    A climate graph: monthly rainfall bars and a temperature line

    Picture: Data: WMO 1991-2020 climate normals, NOAA NCEI

    Climate graph for Riyadh. Which month is coldest?

    AugustOctoberDecemberJanuary

+ 12 more questions in the game.

Picture round: Reading climate graphs

GCSE15 questions· Core· all pictures

Plays in 13 of 17 game modes, including Gold Rush, Big Catch and Fossil Hunt.

Preview 3 sample questions
  1. 1
    A climate graph: monthly rainfall bars and a temperature line

    Picture: Data: WMO 1991-2020 climate normals, NOAA NCEI

    Climate graph for Alice Springs. Which month is warmest?

    JanuaryAprilJulyFebruary
  2. 2
    A climate graph: monthly rainfall bars and a temperature line

    Picture: Data: WMO 1991-2020 climate normals, NOAA NCEI

    Climate graph for Utqiagvik (Barrow). Which month is wettest?

    JulyAugustJanuaryMay
  3. 3
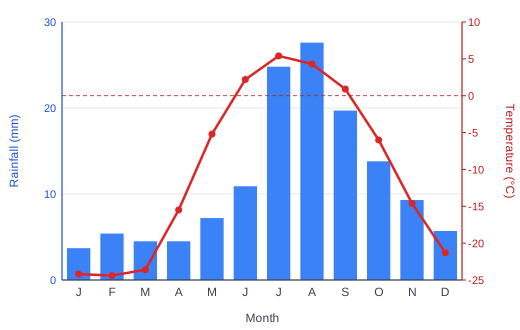
    A climate graph: monthly rainfall bars and a temperature line

    Picture: Data: WMO 1991-2020 climate normals, NOAA NCEI

    Climate graph for Utqiagvik (Barrow). Which month is warmest?

    AugustJulyNovemberFebruary

+ 12 more questions in the game.

Picture round: Reading climate graphs, set 2

GCSE15 questions· Core· all pictures

Plays in 13 of 17 game modes, including Gold Rush, Big Catch and Fossil Hunt.

Preview 3 sample questions
  1. 1
    A climate graph: monthly rainfall bars and a temperature line

    Picture: Data: Met Office historic station data (OGL v3)

    Climate graph for Eskdalemuir. What is the lowest monthly temperature?

    6°C2°C10°C-2°C
  2. 2
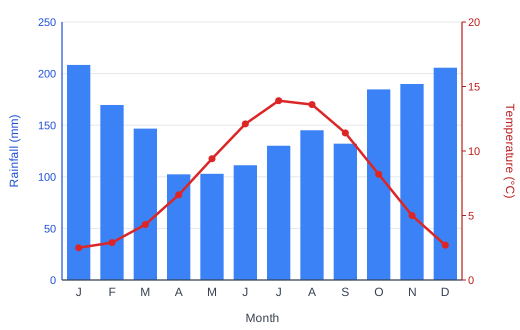
    A climate graph: monthly rainfall bars and a temperature line

    Picture: Data: Met Office historic station data (OGL v3)

    Climate graph for Armagh. What is the highest monthly temperature?

    16°C12°C20°C24°C
  3. 3
    A climate graph: monthly rainfall bars and a temperature line

    Picture: Data: Met Office historic station data (OGL v3)

    Climate graph for Armagh. What is the lowest monthly temperature?

    13°C9°C5°C1°C

+ 12 more questions in the game.

Picture round: Reading climate graphs, set 3

GCSE15 questions· Core· all pictures

Plays in 13 of 17 game modes, including Gold Rush, Big Catch and Fossil Hunt.

Preview 3 sample questions
  1. 1
    A climate graph: monthly rainfall bars and a temperature line

    Picture: Data: WMO 1991-2020 climate normals, NOAA NCEI

    Climate graph for Alice Springs. What is the highest monthly temperature?

    33°C37°C25°C29°C
  2. 2
    A climate graph: monthly rainfall bars and a temperature line

    Picture: Data: WMO 1991-2020 climate normals, NOAA NCEI

    Climate graph for Alice Springs. What is the lowest monthly temperature?

    12°C20°C16°C8°C
  3. 3
    A climate graph: monthly rainfall bars and a temperature line

    Picture: Data: Met Office historic station data (OGL v3)

    Use the climate graph. True or false?

    In Waddington (Lincolnshire), March is warmer than April.

+ 12 more questions in the game.

How hosting works

  1. Pick a set and a game mode. The questions stay the same; the game changes.
  2. Put the join code on the board. Pupils join at subjecthub.co.uk/play on a phone or laptop. They need no account.
  3. Play for 1 to 7 minutes. You choose the length before you start.

Preview every set free. Hosting these sets comes with a school package. See pricing

See how each game mode plays →

← All GCSE Geography A (Edexcel) games · All live games