Climate graphs: reading and drawing
KS3 GeographyL4KS3Lesson packSubscription
Also online
This worksheet marks itself
Set it as homework or classwork and every answer is marked as pupils go, with feedback on what they got wrong. The scores go straight into your mark book, so you can see who needs help before the next lesson.
- 12 questions
- 35 marks
- about 30 minutes
- marked instantly
Question types: calculation, multiple choice, true or false, label the diagram, multi-part.
Try one from this worksheet
What do the bars on a climate graph show?
Pick an answer: it's marked straight away, just as your pupils would see it.
About this resource
Learn how a climate graph shows temperature and rainfall, read the climates of Manaus and Sheffield, plot your own graph and compare two very different places using figures.
14 slides.
Lesson outline
- Two places, two numbers
- Do Now — Retrieval
- Keywords for This Lesson
- How a climate graph works
- The three data sets
- I Do: reading the Manaus graph
- Hinge Check
- We Do: reading the Sheffield graph
- Plot Sheffield's climate
- Compare Manaus and In Salah
- Self-Check: a full-mark comparison
- Homework
Unit bundleEcosystems and biomes
More from Ecosystems and biomes
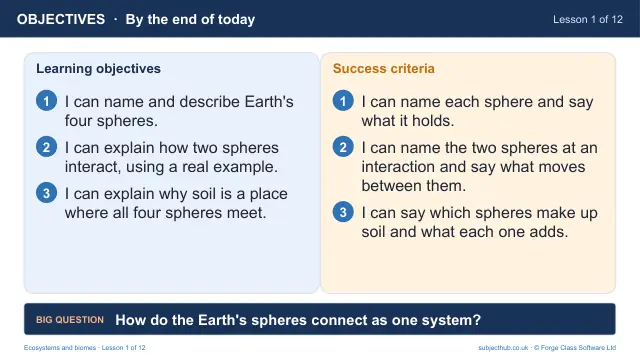
- Lesson pack · L1Earth's spheres: how do the systems connect?Free
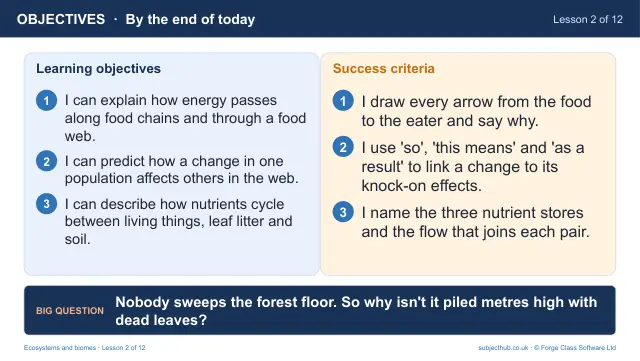
- Lesson pack · L2Ecosystems: food chains, food webs and nutrientsSubscription
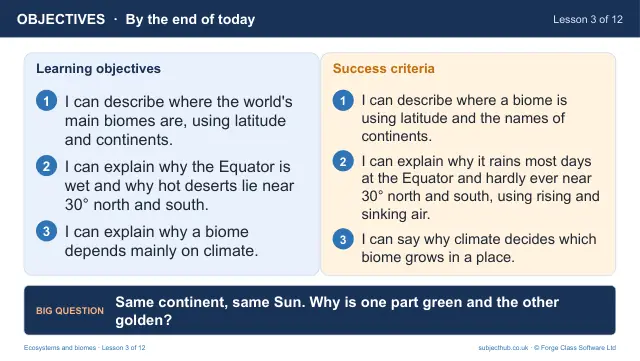
- Lesson pack · L3Global biomes: where are they and why?Subscription
- Lesson pack · L5Tropical rainforests: climate, layers and adaptationsSubscription
- Lesson pack · L6Deforestation in the AmazonSubscription
- Lesson pack · L7Protecting rainforests: Costa RicaSubscription
- Lesson pack · L8Hot deserts: living with heat and droughtSubscription
- Lesson pack · L9Polar environments: Antarctica and the Arctic tundraSubscription