Fieldwork: how does a river change downstream?
This worksheet marks itself
Set it as homework or classwork and every answer is marked as pupils go, with feedback on what they got wrong. The scores go straight into your mark book, so you can see who needs help before the next lesson.
- 12 questions
- 33 marks
- about 35 minutes
- marked instantly
Question types: calculation, short answer, multiple choice, true or false, table completion.
Try one from this worksheet
Illustrative data, not measured. A float took a mean of 25 seconds to travel 10 m at Site A (upper course) and a mean of 12.5 seconds to travel 10 m at Site B (lower course). Which site had the higher velocity?
Pick an answer: it's marked straight away, just as your pupils would see it.
About this resource
Plan and test an enquiry into how a river changes between an upper-course site and a lower-course site. You will measure safely, calculate discharge, test three hypotheses and judge how reliable the results are.
18 slides.
Lesson outline
- Hook
- Do Now — Retrieval
- Keywords for This Lesson
- The enquiry process
- How to measure a river
- Kit and safety
- Today's data: illustrative data, not measured
- I Do: Site A calculations
- We Do and You Do: Site B
- Hinge Check
- Discharge at the two sites
- Test the hypotheses
More from Rivers
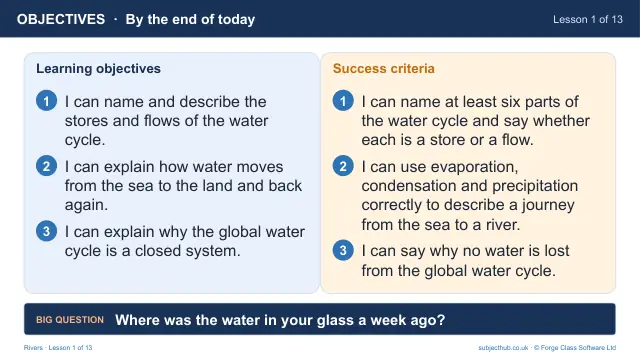
- Lesson pack · L1The water cycle: a global systemFree
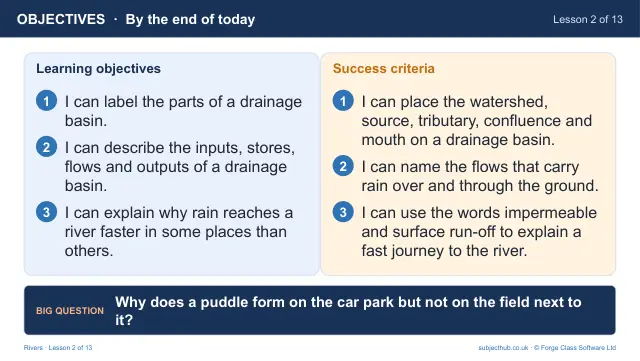
- Lesson pack · L2The drainage basin: how does water reach a river?Subscription
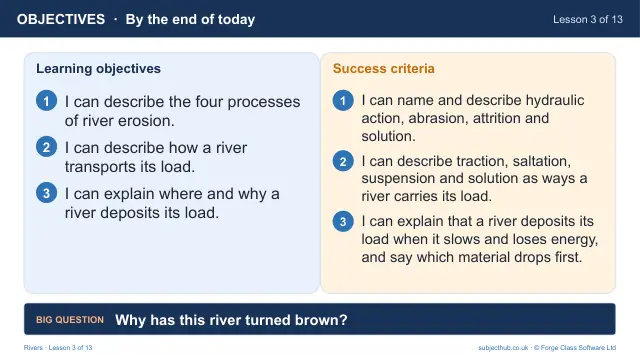
- Lesson pack · L3River processes: erosion, transport and depositionSubscription
- Lesson pack · L4Long profile and cross-profile: how a river changes downstreamSubscription
- Lesson pack · L5Waterfalls and gorgesSubscription
- Lesson pack · L6Meanders and ox-bow lakesSubscription
- Lesson pack · L7Floodplains, levees and estuariesSubscription
- Lesson pack · L8Rivers on OS mapsSubscription