Fieldwork: is biodiversity higher in unmanaged areas? (and extended writing)
This worksheet marks itself
Set it as homework or classwork and every answer is marked as pupils go, with feedback on what they got wrong. The scores go straight into your mark book, so you can see who needs help before the next lesson.
- 11 questions
- 31 marks
- about 30 minutes
- marked instantly
Question types: calculation, short answer, multiple choice, true or false, table completion.
Try one from this worksheet
In our school-grounds fieldwork (illustrative data, not measured), the mean number of plant species per quadrat was 3.3 at Site A (mown grass) and 8.3 at Site B (unmown grass by the hedge). Which site had more plant species on average?
Pick an answer: it's marked straight away, just as your pupils would see it.
About this resource
Plan a fair plant survey, then use quadrat results from a mown and an unmown patch to calculate means and ranges, spot an anomaly and describe what the fieldwork found.
18 slides.
Lesson outline
- Hook
- Do Now — Retrieval
- Keywords for This Lesson
- Teach — the enquiry process
- Teach — the random quadrat method
- Task — Match the kit and the risks
- Teach — today's data
- I Do
- Task — Calculate the means for Site B
- Teach — mean plant species per quadrat at each site
- Hinge Check
- Task — Describe two differences between the sites
More from Ecosystems and biomes
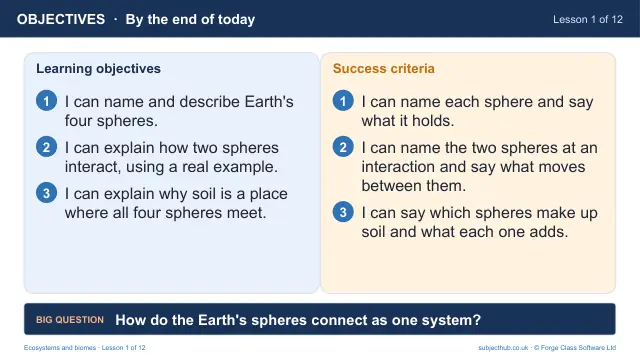
- Lesson pack · L1Earth's spheres: how do the systems connect?Free
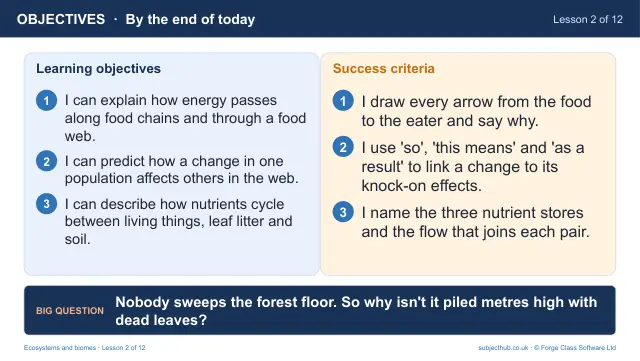
- Lesson pack · L2Ecosystems: food chains, food webs and nutrientsSubscription
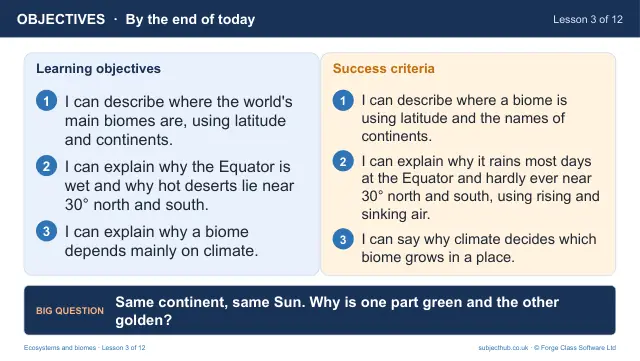
- Lesson pack · L3Global biomes: where are they and why?Subscription
- Lesson pack · L4Climate graphs: reading and drawingSubscription
- Lesson pack · L5Tropical rainforests: climate, layers and adaptationsSubscription
- Lesson pack · L6Deforestation in the AmazonSubscription
- Lesson pack · L7Protecting rainforests: Costa RicaSubscription
- Lesson pack · L8Hot deserts: living with heat and droughtSubscription