Fieldwork 2: what does the data show?
KS3 GeographyL12KS3Lesson packSubscription
Also online
This worksheet marks itself
Set it as homework or classwork and every answer is marked as pupils go, with feedback on what they got wrong. The scores go straight into your mark book, so you can see who needs help before the next lesson.
- 10 questions
- 28 marks
- about 30 minutes
- marked instantly
Question types: short answer, true or false, multiple choice, calculation, table completion.
Try one from this worksheet
Which type of graph would best show the groyne sediment difference at the five Hornsea sites?
Pick an answer: it's marked straight away, just as your pupils would see it.
About this resource
We turn Lesson 11a's beach data into graphs, describe and explain what they show, and evaluate how reliable our method was.
15 slides.
Lesson outline
- Hook
- Do Now — Retrieval
- Keywords for This Lesson
- Teach — the enquiry process; today covers the last four stages: present → analyse → conclude → evaluate
- I Do
- Task — guided: complete the means table for Hornsea sites 2–5, from the raw pebble data
- Teach — teach: results so far — the completed means for all 10 sites, feeding the chart
- Teach — teach: both beach profiles, Hornsea 1 and Skipsea 1, line chart, distance on x, height on y
- Hinge Check
- Task — semi: analyse — the range of beach width for the Hornsea sites
- Discuss — think-pair-share: how reliable is our data?
- Task — independent: conclusion and evaluation, with a frame
Unit bundleCoasts
More from Coasts
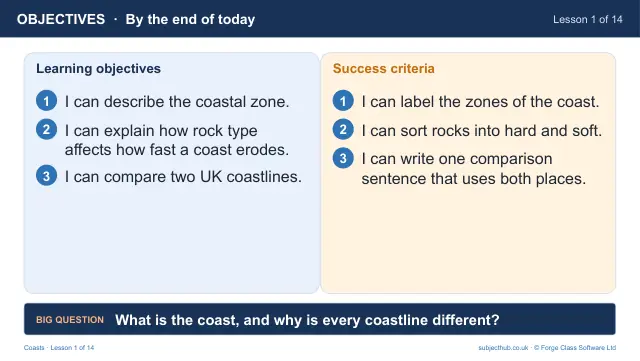
- Lesson pack · L1What is the coast, and why is every coastline different?Free
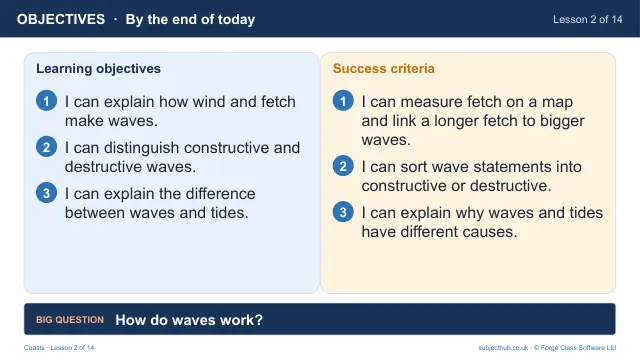
- Lesson pack · L2How do waves work? Fetch, swash and tidesSubscription
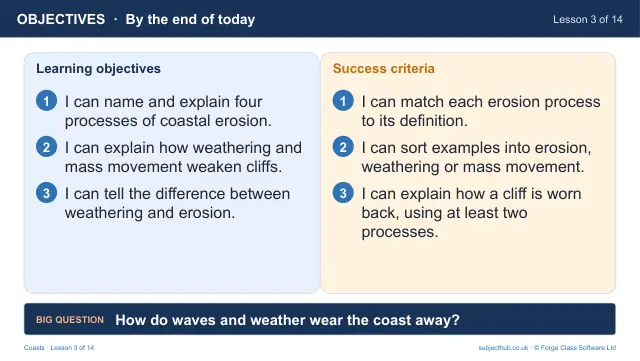
- Lesson pack · L3How do waves and weather wear the coast away?Subscription
- Lesson pack · L4Where does the eroded material go? Longshore drift and depositionSubscription
- Lesson pack · L5Headlands, bays, cliffs and wave-cut platformsSubscription
- Lesson pack · L6From crack to stump: caves, arches and stacksSubscription
- Lesson pack · L7Extended writing: explain how a stack formsSubscription
- Lesson pack · L9Holderness: what happens when the land falls into the sea?Subscription