Population pyramids
KS3 GeographyL4KS3Lesson packSubscription
Also online
This worksheet marks itself
Set it as homework or classwork and every answer is marked as pupils go, with feedback on what they got wrong. The scores go straight into your mark book, so you can see who needs help before the next lesson.
- 12 questions
- 31 marks
- about 30 minutes
- marked instantly
Question types: short answer, multiple choice, true or false, matching, label the diagram.
Try one from this worksheet
Which of these is shown by a population pyramid?
Pick an answer: it's marked straight away, just as your pupils would see it.
About this resource
Learn to read, plot and compare population pyramids, and use their shapes to explain what they show about births, deaths and how long people live.
14 slides.
Lesson outline
- Hook
- Do Now — Retrieval
- Keywords for This Lesson
- Reading the UK pyramid, 2024
- Reading the Niger pyramid, 2024
- I Do
- Hinge Check
- We Do
- Task — Compare the two pyramids using three pairs of figures
- Task — Explain what the pyramid shapes show
- Self-Check
- Homework
Unit bundlePeople, migration and cities
More from People, migration and cities
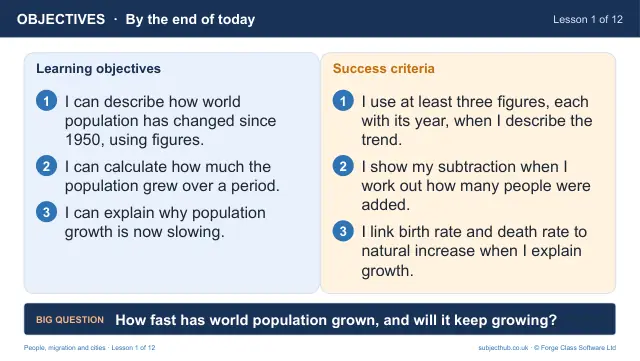
- Lesson pack · L1World population: how fast is it growing?Free
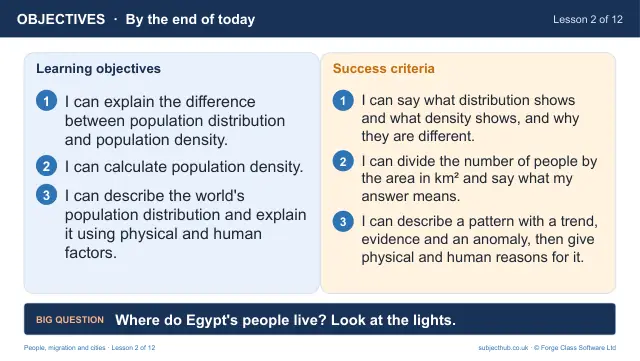
- Lesson pack · L2Where do people live? Distribution and densitySubscription
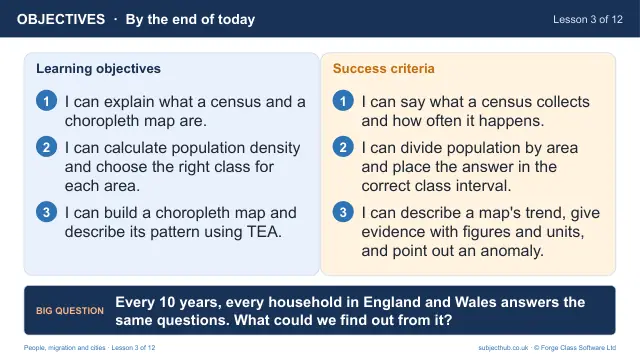
- Lesson pack · L3Mapping people with GIS: census choropleth mapsSubscription
- Lesson pack · L5Why do people migrate?Subscription
- Lesson pack · L6Migration: routes, refugees and the UKSubscription
- Lesson pack · L7Urbanisation: why are cities growing?Subscription
- Lesson pack · L8How has a UK city changed?Subscription
- Lesson pack · L9What makes a city sustainable?Subscription